Phase 8 - Cortex Observables
Last updated by: Syed Mahmood Aleem Huzaifa, Last updated on: 23/09/2025
Document Creation: 3 September 2025. Last Edited: 9 September 2025. Authors: Syed Mahmood Aleem Huzaifa.
Effective Date: 9 September 2025. Expiry Date: 9 September 2026.
Overview
Running manual observables in TheHive is useful for on-demand data enrichment. Instead of waiting for automation or notifications to trigger analyzers, suspicious items can be checked quickly and supporting intelligence viewed immediately. This workflow ensures every piece of evidence is enriched, traceable, and stored within the case context for comprehensive investigation.
Step 1 – Log in to TheHive
Open TheHive web interface in a browser and log in with an analyst account. Access to the dashboard where cases and observables are managed requires proper permissions; usually, the Analyst role is necessary to create observables and trigger Cortex analyzers.
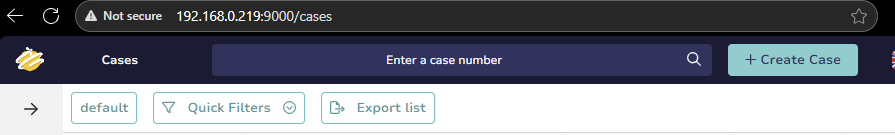
Step 2 – Open a Case
After logging in, create a new case or open an existing one. A case serves as a container for all investigation data, ensuring observables are associated with the correct incident context.
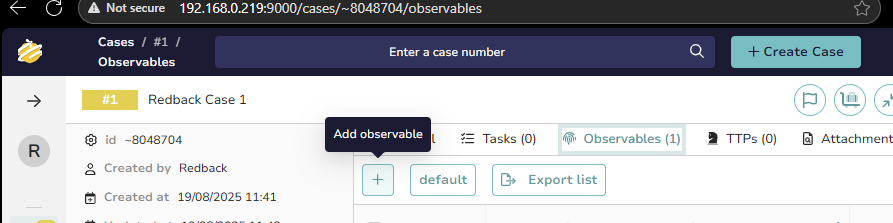
Step 3 – Add an Observable
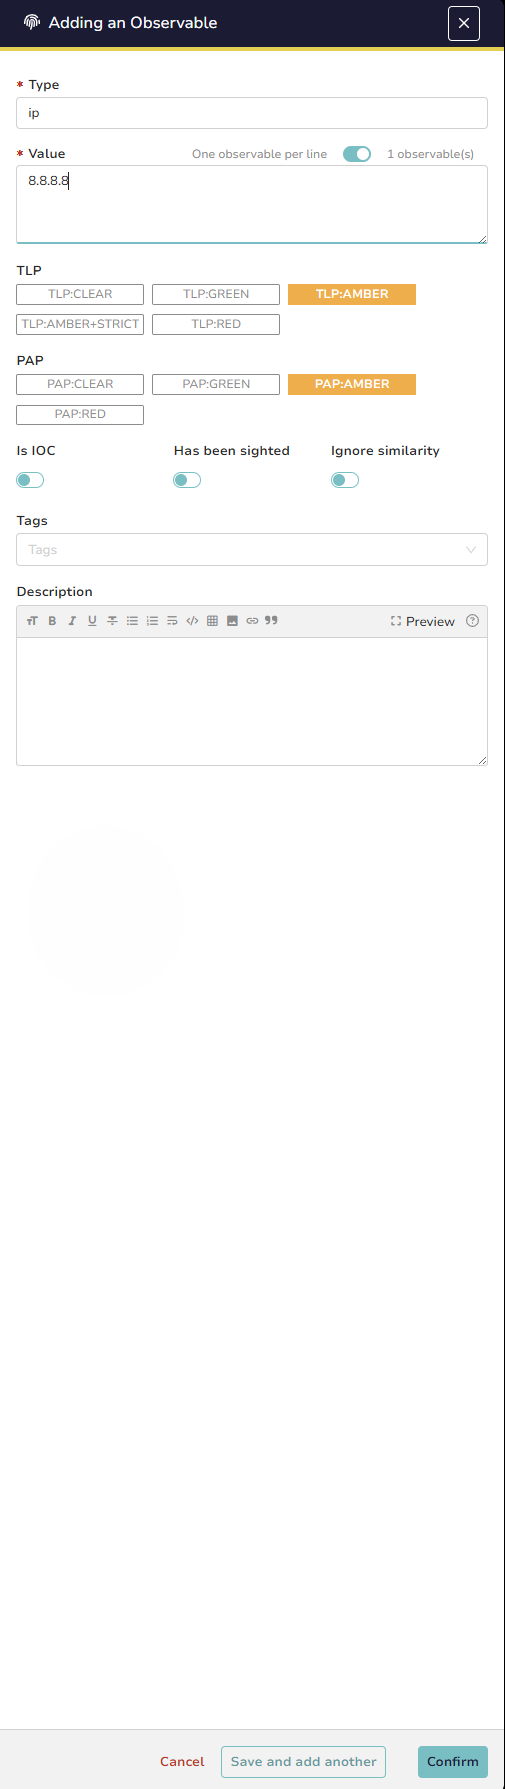
Within the case, navigate to the “Observables” tab and select “Add Observable.” Choose the observable type such as IP address, domain, file hash, or URL. Provide the observable value and optionally add descriptions or tags to assist later correlation or filtering.
Step 4 – Save the Observable
Save the observable, which then appears in the case observables list. At this stage, the observable is stored but no analysis has yet been performed.
Step 5 – Run Cortex Analyzer Manually
Select the observable and click *“Run analyzers.” TheHive displays available Cortex analyzers compatible with the observable type, for example, AbuseIPDB or VirusTotal for IP addresses. Select desired analyzers and confirm to send the observable to the connected Cortex instance for analysis.
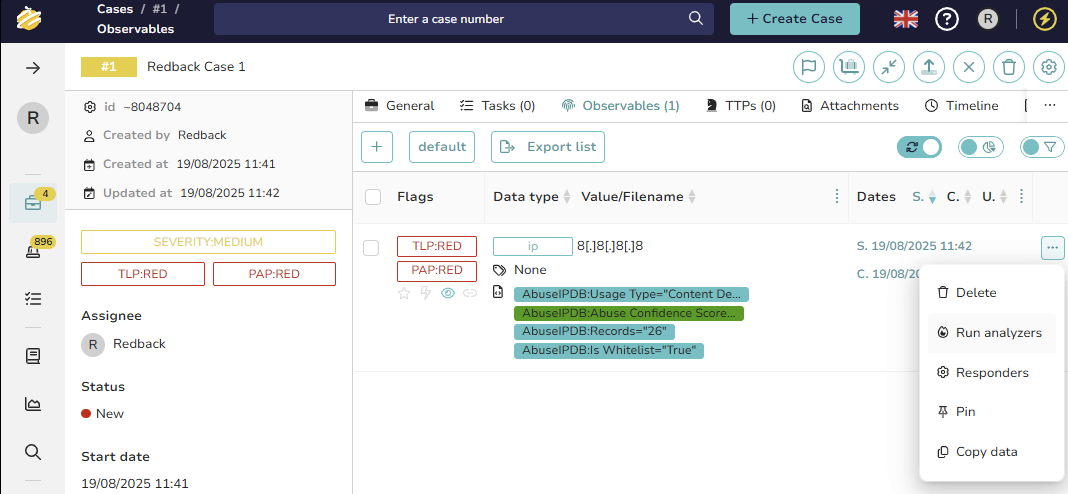
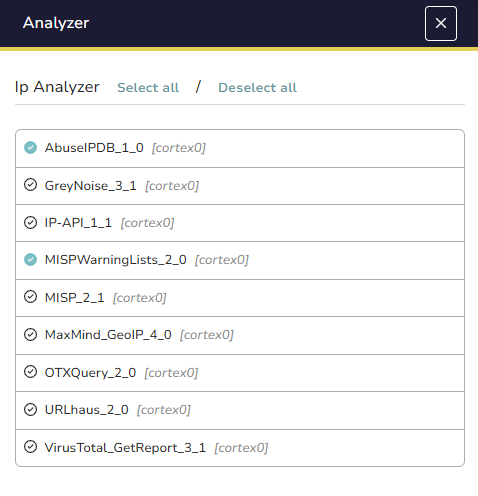
(Only the analyzers that are configured and enabled in Cortex would be visible here)
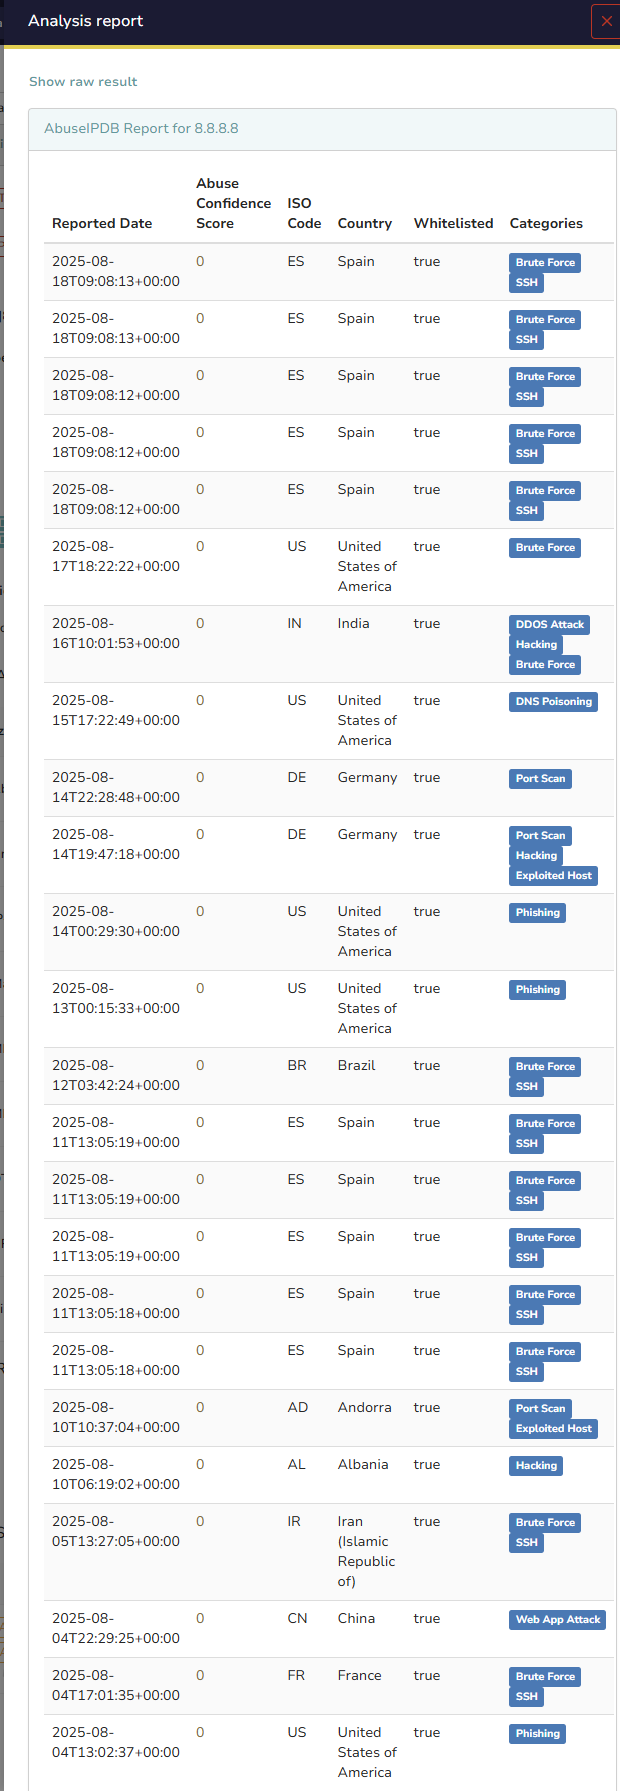
Step 6 – Review the Reports
After analyzer jobs complete, click the observable to view detailed reports. Reports reveal findings such as malicious IP status, malware hash matches, or URL blocklist presence. These results are attached to the observable in TheHive, enabling efficient investigation continuation.
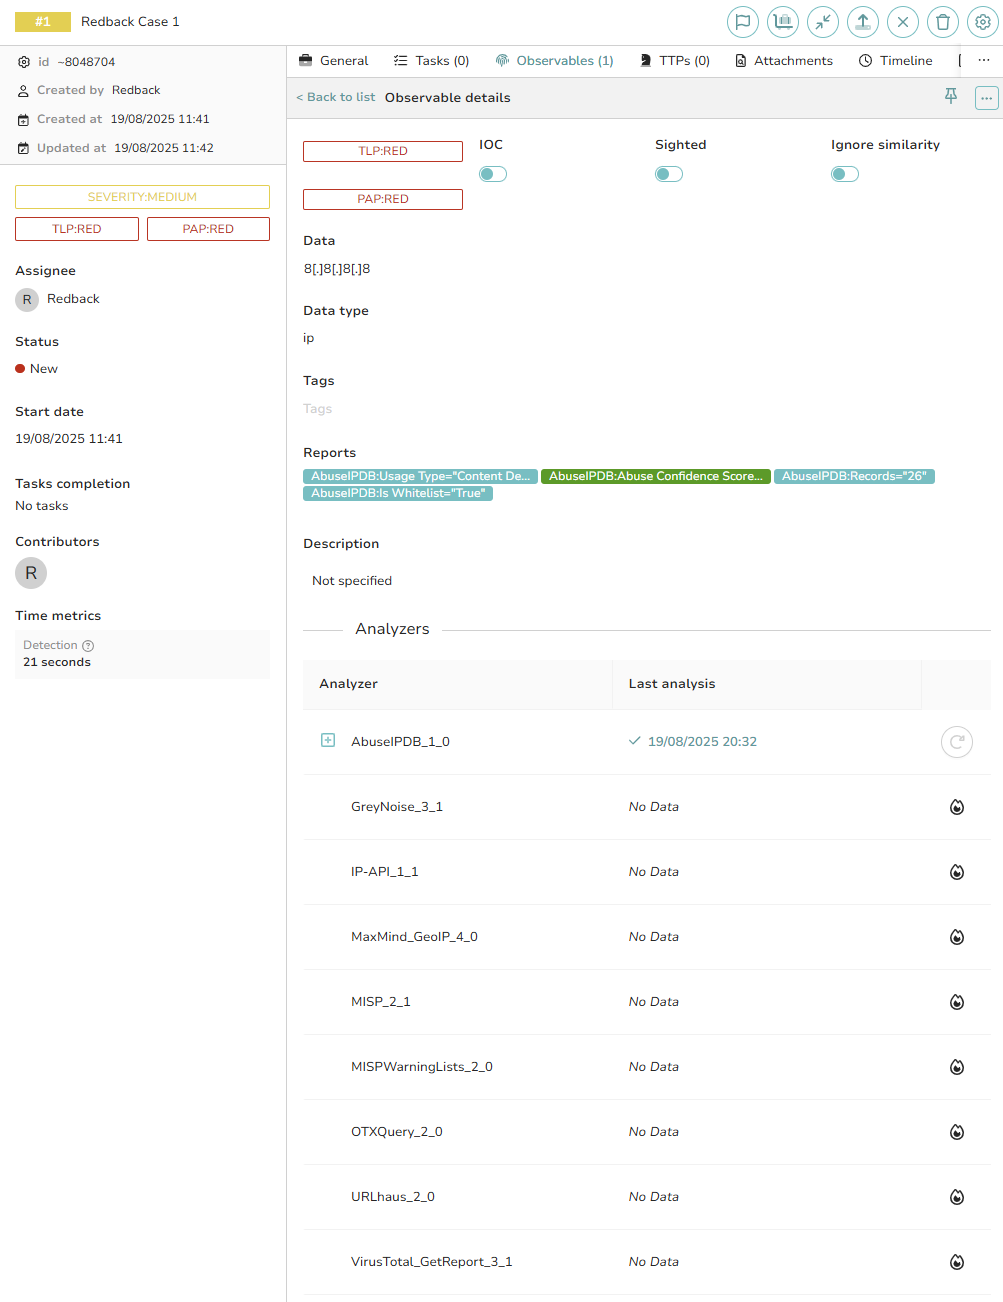 Analysis_of_a_report.png